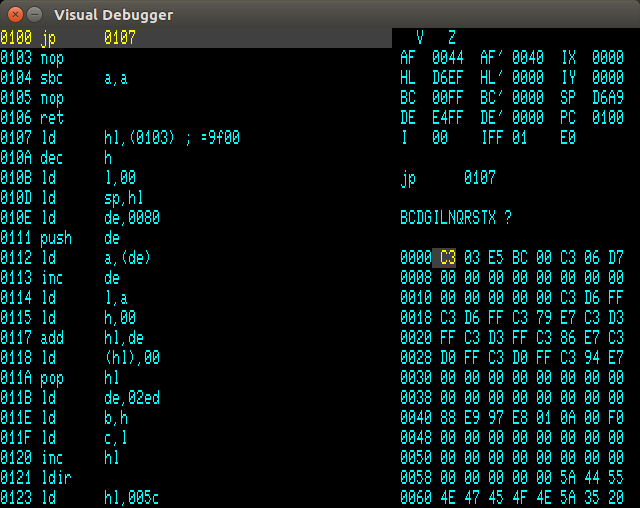
The MEMU Visual Debugger is a machine code inspector and debugger similar to the MTX PANEL command or the CP/M VDEB utility. However it offers a number of advantages over those tools:
There is a shortage of spare keyboard keys to control all the various features of MEMU. Andy's solution to that is to use one of the function keys as a debugging "shift" key. Holding this key down while pressing letter keys controls various diagnostic features. In Andy's original MEMU, F9 is used for this. In my fork, F9 has been used for <Line Feed>, so F10 is used as the debug shift key. With this key down, the effects of the various letter keys are:
| Key | Description |
|---|---|
| a | Toggles accelerated mode |
| b | Toggles -diag-mem-iobyte |
| c | Toggles -diag-console |
| d | Dump memory to memu.mem |
| f | Toggles -diag-cpm-bdos-file |
| h | Halts Z80 and displays Visual Debugger |
| i | Toggles -diag-z80-interrupts |
| k | Toggles -diag-kbd-sense |
| l | Loads ZX snapshot file, as specified by -sna-file |
| m | Toggles -diag-speed |
| p | Toggles -diag-bad-port-display |
| q | Toggles -diag-bad-port-ignore |
| r | Dumps a snapshot of the Z80 registers |
| s | Saves ZX snapshot file, as specified by -sna-file |
| t | Rewinds to the start of a ZX tape file |
| v | Dumps a snapshot of the VDP registers |
| w | Snapshots the VDP screen to memuNNNNNN.bmp |
| x | Toggles auto VDP snapshot mode on or off |
| y | Toggles -diag-spec-ports |
| z | Toggles -diag-z80-instructions |
Visual Debugger commands are invoked by pressing the key corresponding to the capital letter of the command. It should be noted that if the debug function key (F9 or F10) is held down, then the keys have the effect listed above instead.
Sets an address at which program execution will halt. Enter the required address as a hex number, and type <Return>. When prompted for the Break Condition (COND>) there are a number of options:
Note that the Break command can only set one break condition at each address. However there may be breaks set for a number of different addresses.
Clears a break condition set at a specified address.
Displays a block of memory starting at the specified address. The values starting at this location may then be changed by typing two digit hex values followed by <Return>. Use <Esc> to stop editing values.
Starts program execution at specified address. If no address is specified (just <Return>) then start at the current value of the program counter (i.e continue execution). Optionally ("TO>" prompt) specify an address where execution is to halt again.
Toggle between displaying memory in hex or ASCII.
List machine code starting at a specified address. If an address is specified, then the listing will remain fixed, starting at this address. If no address is given, then the listing will start at the location of the program counter, and will be updated whenever the program counter leaves the displayed listing.
Sets a temporary break point at the next instruction, and then starts execution.
Toggles on and off collection of an execution profile.
When turned on, all the counts are reset to zero, and a count of the number of instructions executed is shown to the right of the prompt line.
When turned off, the number of times each instruction was executed since profiling was turned on is saved to a file with the name "Profile_<date>_<time>.txt" in the current folder, with the format:
Address    	     Count
DBFD - DC00	      1920
FC65 - FC6D	      1542
FC6F - FC71	      1536
FE1D - FE1E	       450
DD20 - DD22	       290
DE53 - DE55	       241
DE58 - DE61	       228
DE64 - DE67	       227
Quits the Visual Debugger. The window will be closed and all breakpoints will be inactive until the Visual Debugger is re-opened.
Updates the value of the register pair pointed to by the register cursor. This cursor is moved by the stop "." key. Note that there is one step in the cycle when no register is selected.
Executes a single machine code instruction then updates the display.
For most machine code instructions, this is the same as "Step". For a subroutine call (one that is taken for a conditional call), execute until a return statement brings the stack pointer back to the current value. For most subroutines, this will execute the routine as a single step, even if the call is followed by parameter bytes. It will fail if the routine does not finish with a return statement (e.g. finishes with "JP (HL)").
Attempts to exit the current subroutine. Works by running until a return statement is executed with the stack pointer at the current value. This will usually work if you have just mistakenly stepped into a routine you are not interested in. It will fail if there have been mis-matched PUSH and POP statements since the subroutine call.